Driving Profitability by Keeping Score
 Two thousand and seventeen proved to be a pretty good year for banks, and 2018 promises to be even better. While the economic environment of lower taxes, rising rates and promises of deregulation have driven up valuations, the secret sauce that produces results still eludes many. The answer lies deep within banks and can be realized by implementing balanced scorecards throughout that hold people accountable for performance and provide targets for success that drive the bottom line.
Developing benchmarks by individual business lines to enforce accountability can help them improve their staffing, processes and strategies, and often exposes low performers and manual processes that negatively impact profitability. Although this seems logical, in practice few banks have had success in figuring out these scorecards.
The following best practice tips will help in creating these metrics, setting appropriate goals and designing an effective overall performance management strategy.
Keep it Simple: Every department should be working with five to seven (not 20) easy-to-track metrics. Too much detail can cause confusion as well as create more work than it’s worth to calculate. For example, tracking the average time customers wait in line in branches is next to impossible and non-productive, but tracking call center hold times is much easier and most likely exists in a canned report today.
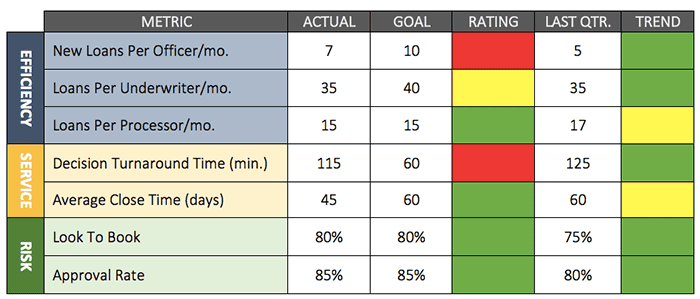
Take a Balanced Approach: A mixture of efficiency, quality and risk benchmarks provides a good balance. The following example of a balanced scorecard in mortgage lending illustrates risk metrics including approval rates, average credit score, client service metrics for turnaround times and efficiency metrics for production of loan officers, processors and underwriters.
 Focus on the Outliers: Tracking performance is only the first step in developing a scorecard system. As the performance culture matures and as data trends become clearer, identifying outliers and improving performance in those areas is the key. Becoming a high performer sometimes means changing an underlying process or technology. But it can also come down to one or two individuals who are driving either high or low performance. Digging in to understand those variants can pay significant dividends. For example, in our sample scorecard, one loan officer was doing 15 loans per month while others were doing three to four.
While compensation structure can account for some of this variance, the opportunity cost to get those lower performers up to at least average can be significant. It turns out that the officer doing 15 loans per month had reached out to marketing for lists of clients new to the bank that had mortgages at other institutions and was cross-selling those in his market while the others had no idea the information was available.
When it comes to revenue generation, most banks have squeezed expenses and capitalized on the low-hanging fruit. The next step is to drive the bottom line through well-thought-out business line scorecards that produce actionable data to improve performance. The goal is to use these key performance indicators to drive better processes, strong customer service, less risk and higher returns to shareholders.

